Sales in one development make up over a third of total
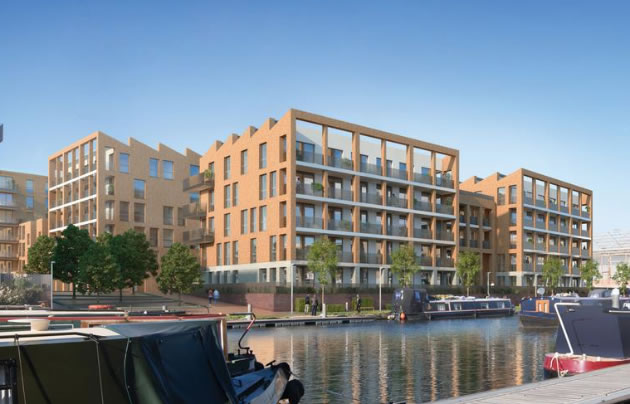
Second phase of Brentford Lock West
|
An otherwise moribund Brentford property market is apparently seeing support from the Help To Buy scheme which provides government loans to buyers to enable purchases.
The latest sales information released by the Land Registry shows that over a third of the 67 sales reported so far in the TW8 postcode area in the last quarter of 2018 were in Isambard Court on Boaters Avenue which is part of the second phase of the Brentford Lock West development.
One local estate agent said, "They are a achieving good prices for a part of the development that is not facing the water which is very encouraging. I would assume that many of these sales are enabled by the Help To Buy London scheme. The Government is desperate to support the housing market and will do whatever it is necessary to ensure that new developments get sold. Without this the Brentford property market would be more or less dead"
Under Help To Buy the purchaser must provide at least a 5% deposit but then the Government will provide up to 40% of the value of a newly built property as an equity loan reducing the risk for the bank which provides the rest of the purchase price. The scheme is available for homes up to £600,000 and is currently set to run until March 2023. No interest is charged on the equity loan for the first five years.
Such funding is available for properties in the first phase of the Brentford Lock development.
It is widely hoped that the scheme will enable the massive number of flats due to come to the market in the Brentford area to be sold many of which will be in locations much less attractive than the waterside developments.
Despite this support for the market property prices fell on average by 5.3% to £504,746 and, excluding the sales in Brentford Lock West, turnover is down to historically low levels.

UK house prices grew by 2.5% in the year to December 2018. This is the lowest annual growth for the UK since July 2013. London property prices fell marginally over the year with only the North East also seeing a decline.
Tom Bill, Partner and Head of London Residential Research at Knight Frank said, "The influence of political uncertainty on the prime London property market has grown markedly in the last six months. In the first half of 2018 there were signs the market was beginning to rally as asking prices adjusted more fully to reflect higher transaction costs.
"However, with Brexit uncertainty persisting ahead of the UK’s planned departure from the EU, sales volumes in prime outer London were down by 10% year-on-year in January and the annual price decrease widened to 4.6%.
"Identifying individual factors affecting the performance of the prime London property market can be a complex task but the impact of political uncertainty was decisive during 2018. Indeed, economic sentiment indicators displayed a similar trend. The Lloyds business barometer began the year with a reading of 35% in January but had fallen to 17% by December.
"However, there are signs that pent-up demand is building. The number of new prospective buyers registering rose by 5% across prime London markets in 2018. Indeed, the ratio of new demand to new supply rose to 4.9 in the final quarter of 2018, the highest level in four years.
While it is unknown when the current level of political uncertainty will recede, the conditions for a recovery in the London property market appear to be taking shape.
Robert Gardner, Nationwide's Chief Economist, said ““Indicators of housing market activity, such as the number of property transactions and the number of mortgages approved for house purchase, have remained broadly stable in recent months, but forward-looking indicators had suggested some softening was likely.
“In particular, measures of consumer confidence weakened in December and surveyors reported a further fall in new buyer enquiries towards the end of 2018. While the number of properties coming onto the market also slowed, this doesn’t appear to have been enough to prevent a modest shift in the balance of demand and supply in favour of buyers in recent months.”
The Bank of England’s Agents’ summary of business conditions for 2018 Q4 reported that along with low supply of houses, demand was also falling. Housing activity in southern England was muted due to uncertainty, with transactions postponed until after the EU withdrawal. The demand for new build houses remained stronger outside London, in part due to housebuilders offering more incentive to finalise sales.
The Royal Institution of Chartered Surveyors’ (RICS) UK Residential Market Survey for December 2018 reported that new buyer enquiries fell for the fifth month in a row. This fall in demand was accompanied by a lack of fresh stock coming into the market as the survey’s indicator on new instructions remained in negative territory for the sixth report in a row.
The UK Property Transactions Statistics for December 2018 showed that on a seasonally adjusted basis, the number of transactions on residential properties with a value of £40,000 or greater was 102,330. This is 3.6% higher than a year ago. Between November 2018 and December 2018, transactions fell by 0.1%.
The Bank of England’s Money and Credit latest release showed that mortgage approvals for house purchases (an indicator of future lending) were around 63,800 in December, unchanged from November, but slightly below their 2018 average of around 65,200.
Regular updates on the local property market are published in the weekly BrentfordTW8.com newsletter.
| Brentford Property Prices - (October - December 2018) | ||||||||
|---|---|---|---|---|---|---|---|---|
| Area | Semi-det | Sales | Terrace | Sales | Flat/ mais |
Sales | Overall Ave | Total Sales |
| TW8 0 | 450000 | 1 | 645737 | 4 | 410750 | 24 | 444516 | 29 |
| TW8 8 | 900000 | 1 | 0 | 0 | 533962 | 26 | 547519 | 27 |
| TW8 9 | 657500 | 2 | 627833 | 6 | 354000 | 3 | 558545 | 11 |
| Total | 666250 | 4 | 634995 | 10 | 467981 | 53 | 504746 | 67 |
Change |
3.3% | 33.3% | 8.5% | -16.7% | 9.0% | -5.4% | 8.6% | -5.6% |
Change |
-9.7% | 0.0% | -0.6% | -23.1% | -6.9% | -27.4% | -5.3% | -25.6% |
Change |
25.6% |
-33.3% |
10.9% |
-64.3% |
-4.7% |
-71.0% |
-1.1% |
-69.3% |
| Change in 5 years |
27.3% | 0.0% | 53.1% | -50.0% | 53.3% | -52.7% | 54.0% | -50.7% |
Change |
108.9% | -20.0% | 134.5% | 233.3% | 105.6% | 120.8% | 105.3% | 109.4% |
Where do I live? Brentford TW8 postcodes are divided into three sectors, TW8 0xx, TW8 8xx and TW8 9xx. Broadly speaking, TW8 0xx covers areas east of Boston Manor Road, TW8 8xx goes west of Boston Manor Road, whilst TW8 9xx covers the areas to the north of the A4.
Source: Land Registry
March 22, 2019
![]()