Schemes dependent on flat sales may face funding concerns
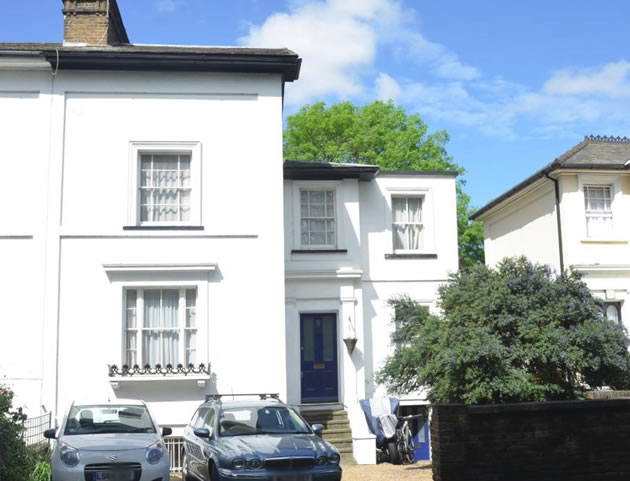
Windmill Road house went for £1million
|
Demand for flats in the Brentford area appears to have plunged so far this year with only 16 sales reported to date. With over two thousand new units in the pipeline, the viability of some of the major new developments in the area would be questionable if these market conditions persisted.
The evaporation of demand for newly built flats seems to be general across London. Anecdotally flats without unique selling points such as attractive views are proving very difficult to sell at the moment. Many of the new developments planned for the Brentford area are in brownfield sites and close to major carriageways.
Sales at discounts including those of 'affordable' discount to market units are not recorded by the Land Registry but they would only make up a small proportion of the ongoing developments.
Local agents have said that stamp duty changes and regulatory and tax changes making buy-to-let investment less attractive have led to a fall in demand for flats.
A continuation of these market conditions may raise a question mark over some of the projects which are dependent on flat sales to proceed such as the new Watermans Centre. The Brentford Stadium development may however be relatively immune as initially this is being funded by sales of houses at the Griffin Park site and demand in this sector remains relatively robust. Even in the current challenging conditions a house on Windmill Road changed hands for £1,000,000.
The average sale price in the TW8 post code area in the first quarter is down by 14.1% over the last year but with only 26 sales in all there is too little activity to conclude that this decline is representative of the broader market.

According to the Nationwide House Price Index, property values in London as a whole fell by 1% in March compared with the same month last year. For the UK overall prices are up by 2.1% and the gap between the capital and the rest of the country has been slowly reduced over the last few months.
Commenting on the figures, Robert Gardner, Nationwide's Chief Economist, said: “Looking ahead, much will depend on how broader economic conditions evolve, especially in the labour market,
but also with respect to interest rates. Subdued economic activity and the ongoing squeeze on household budgets is likely to continue to exert a modest drag on housing market activity and house price growth this year."
Home ownership rates have declined across all English regions over the past decade. While the decline has been fairly uniform across regions, the biggest reduction has been in London, where the home ownership rate has fallen from 57% to 47%. The counterpart to this has been robust growth in the private rental sector; for example, 30% of households in London now rent.
The RICs say that their surveyor members report on balance an expectation of no price rises over the next 12 months representing the joint lowest reading since February 2013. Regionally, there continues to be significant variation in the house price indicator. London, exhibits the weakest feedback, with a net balance of -47% of respondents citing further price declines.
| Brentford Property Prices - (January to March 2018) | ||||||||
|---|---|---|---|---|---|---|---|---|
| Area | Semi-det | Sales | Terrace | Sales | Flat/ mais |
Sales | Overall Ave | Total Sales |
| TW8 0 | 0 | 0 | 497000 | 4 | 398594 | 8 | 431396 | 12 |
| TW8 8 | 0 | 0 | 0 | 0 | 505000 | 3 | 505000 | 3 |
| TW8 9 | 471500 | 1 | 604100 | 5 | 373590 | 5 | 487268 | 11 |
| Total | 471500 | 1 | 556500 | 9 | 410731 | 16 | 463527 | 26 |
Change in Quarter |
-36.1% | -75.0% | -12.9% | -30.8% | -18.3% | -76.1% | -13.4% | -69.0% |
Change in year |
-33.0% | -66.7% | -4.9% | -10.0% | -22.0% | -78.1% | -14.1% | -69.8% |
Change in 3 years |
-30.5% |
-80.0% |
-3.3% |
-18.2% |
-6.2% |
-85.6% |
1.0% |
-79.7% |
| Change in 5 years | 21.6% | -75.0% | 41.3% | -43.8% | -7.6% | -72.9% | 7.5% | -67.1% |
Change in 10 years |
11.2% | -80.0% | 70.1% | 0.0% | 31.9% | -42.9% | 41.3% | -38.1% |
Where do I live? Brentford TW8 postcodes are divided into three sectors, TW8 0xx, TW8 8xx and TW8 9xx. Broadly speaking, TW8 0xx covers areas east of Boston Manor Road, TW8 8xx goes west of Boston Manor Road, whilst TW8 9xx covers the areas to the north of the A4.
Source: Land Registry
May 11, 2018
![]()