Property market transactions in TW8 at highest level for nearly a decade
|
Brentford's property market saw high levels of turnover towards the end of last year with buyers snapping up cheaper priced units in new apartment developments.
In the first half of 2013 the average property price reached a new all-time high as luxury units in riverside developments were marketed.
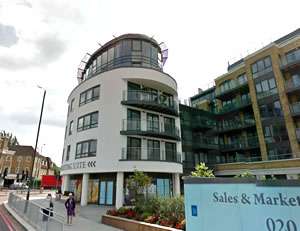
However, more recently sales in less expensive developments such as Trico House and Lincoln House have predominated driving the average price down to £328,995. The level peaked at over £400,000 but prices are still 5.9% above the same period last year.
Almost two thirds of sales are of flats in the east of the borough and the 129 homes sold during the quarter represents the highest level of turnover seen for nearly ten years
The December data from Land Registry's House Price Index shows that London remains the best performing property market in England and Wales. The average price of a home in the capital rose by 11.2% over the year to £403,972.
For the country as a whole prices rose by 4.4% which takes the average property value in England and Wales to £167,353. Repossession volumes decreased by 28 per cent in July 2013 to 1,187 compared with 1,645 in July 2012.
The most up-to-date figures available show that during October 2013 the number of completed house sales in England & Wales increased by 21 per cent to 71,929 compared with 59,213 in October 2012. The number of properties sold in England and Wales for over £1 million in October 2013 increased by 40 per cent to 913 from 651 in October 2012.
Ray Upcraft, from Russell Collins Estate Agents commented: "The year has begun with a real bang with many properties being sold for considerably in excess of guide price.
"We are seeing a big overflow of buyers from Brentford’s more ‘illustrious’ neighbours such as Ealing/Chiswick/Richmond etc.
"There is no immediate signs of the TW8 market slowing down. Far from it in fact and we expect the rest of the year to continue as it has started."
Julia Quilliam of Qulliam Property added “Brentford has seen a steady rise in demand over the past six months for both those looking to buy and rent. As the new developments such as the Boardwalk and the Alfa Laval site rise up into the sky, Brentford is fast becoming a destination town in its own right. People from all over London (particularly from Hammersmith and Shepherds Bush) are looking to come to Brentford to settle down. Brentford’s reputation as a town that offers its citizens an excellent quality of life built around the Thames and the Grand Union Canal is enhanced by new ventures such as the successful Sunday Market and the possibility of a new free school. Whilst all properties in the town are enjoying excellent demand, not seen for years, period houses are quick to be snapped up!”
A list of properties sold in the Brentford area will appear in a forthcoming edition of the BrentfordTW8.com newsletter.
| Brentford Property Prices - (October - December 2013) | ||||||||
|---|---|---|---|---|---|---|---|---|
| Area | Semi-detached | Sales | Terraced | Sales | Flat/ mais |
Sales | Overall Averages | Overall Sales |
| TW8 0 | - | - | 389833 | 9 | 299743 | 81 | 308752 | 90 |
| TW8 8 | 470000 | 1 | - | - | 362016 | 14 | 369215 | 15 |
| TW8 9 | 541000 | 3 | 435082 | 11 | 270555 | 10 | 379769 | 24 |
| Total | 523250 | 4 | 414720 | 20 | 305266 | 105 | 328995 | 129 |
| Change in Quarter | 23.9% | 100.0% | 1.6% | -25.9% | -3.4% | 45.8% | -4.1% | 27.7% |
| Change in year | 46.7% | 33.3% | 14.2% | 25.0% | 9.0% | 228.1% | 5.9% | 152.9% |
| Change in 3 years | - | - | -26.8% | 100.0% | 25.2% | 123.4% | 27.3% | 126.3% |
| Change in 5 years | - | - | 53.1% | 566.7% | 34.1% | 337.5% | 33.8% | 303.1% |
| Change in 10 years | 89.4% | -66.7% | 53.6% | -35.5% | 8.0% | -15.3% | 17.6% | -22.8% |
| Brentford Property Prices - (July - September 2013) | ||||||||
|---|---|---|---|---|---|---|---|---|
| Area | Semi-detached | Sales | Terraced | Sales | Flat/ mais |
Sales | Overall Averages | Overall Sales |
| TW8 0 | - | - | 375144 | 17 | 332080 | 49 | 343172 | 66 |
| TW8 8 | 345000 | 1 | 840000 | 1 | 299909 | 17 | 330708 | 19 |
| TW8 9 | 499500 | 1 | 423056 | 9 | 232075 | 6 | 356216 | 16 |
| Total | 422250 | 2 | 408331 | 27 | 316150 | 72 | 342894 | 101 |
| Change in Quarter | -20.3% | -71.4% | 4.1% | 42.1% | -25.0% | 9.1% | -20.6% | 7.4% |
| Change in year | -16.1% | -33.3% | -1.9% | 107.7% | -2.6% | 20.0% | -1.3% | 32.9% |
| Change in 3 years | - | - | 13.8% | 58.8% | 31.8% | 89.5% | 24.0% | 83.6% |
| Change in 5 years | - | - | 18.1% | 285.7% | 17.9% | 100.0% | 22.1% | 134.9% |
| 95.0% | -77.8% | 47.6% | 12.5% | 21.4% | -32.7% | 31.7% | -27.9% | |
Where do I live? Brentford TW8 postcodes are divided into three sectors, TW8 0xx, TW8 8xx and TW8 9xx. Broadly speaking, TW8 0xx covers areas east of Boston Manor Road, TW8 8xx goes west of Boston Manor Road, whilst TW8 9xx covers the areas to the north of the A4.
Source: Land Registry
February 12, 2014
![]()