New record price level as buyers move from apartments to houses
|
Brentford's property prices took a tumble in the third quarter of 2013 according to the latest official figures.
After hitting an all-time high in the previous three months, the average price of a home in the TW8 post code area from July to September fell by 20.6% to £342,894.
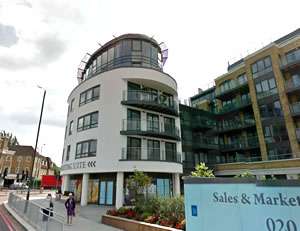
Nearly half the sales during the period were in the Kew Bridge area and it would appear that the precipitous fall is due to developers marketing cheaper priced units having previously been selling the more expensive apartments in their developments.
The September data from Land Registry's House Price Index shows that London remains the best performing property market in England and Wales. The average price of a home in the capital rose by 9.3% over the year to £393,462.
Jon Pishiri, RICS London residential spokesperson commented, “Increasing demand and continuing low supply are major determinants in London prices being pushed up. The Help to Buy initiative coupled with rising rental values are further encouraging people to purchase a house as opposed to renting. There is an obvious need to increase supply to the market in order to address this problem.”
For the country as a whole prices rose by 3.4% which takes the average property value in England and Wales to £167,063. Repossession volumes decreased by 28 per cent in July 2013 to 1,187 compared with 1,645 in July 2012.
The number of properties sold in England and Wales for over £1 million in July 2013 increased by 34 per cent to 1,143 from 852 in July 2012.
A list of properties sold in the Brentford area will appear in a forthcoming edition of the BrentfordTW8.com newsletter.
| Brentford Property Prices - (July - September 2013) | ||||||||
|---|---|---|---|---|---|---|---|---|
| Area | Semi-detached | Sales | Terraced | Sales | Flat/ mais |
Sales | Overall Averages | Overall Sales |
| TW8 0 | - | - | 375144 | 17 | 332080 | 49 | 343172 | 66 |
| TW8 8 | 345000 | 1 | 840000 | 1 | 299909 | 17 | 330708 | 19 |
| TW8 9 | 499500 | 1 | 423056 | 9 | 232075 | 6 | 356216 | 16 |
| Total | 422250 | 2 | 408331 | 27 | 316150 | 72 | 342894 | 101 |
| Change in Quarter | -20.3% | -71.4% | 4.1% | 42.1% | -25.0% | 9.1% | -20.6% | 7.4% |
| Change in year | -16.1% | -33.3% | -1.9% | 107.7% | -2.6% | 20.0% | -1.3% | 32.9% |
| Change in 3 years | - | - | 13.8% | 58.8% | 31.8% | 89.5% | 24.0% | 83.6% |
| - | - | 18.1% | 285.7% | 17.9% | 100.0% | 22.1% | 134.9% | |
| 95.0% | -77.8% | 47.6% | 12.5% | 21.4% | -32.7% | 31.7% | -27.9% | |
Brentford Property Prices - (April - June 2013) |
||||||||||
|---|---|---|---|---|---|---|---|---|---|---|
| Area | Detached | Sales | Semi-Det | Sales | Terraced | Sales | Flat/ Mais |
Sales | Total Ave | Total Sales |
| TW8 0 | - | - | 455,000 | 1 | 393,710 | 12 | 462,034 | 54 | 449,692 | 67 |
| TW8 8 | - | - | 682,500 | 2 | 397,000 | 5 | 263,464 | 7 | 371,018 | 14 |
| TW8 9 | 820,000 | 2 | 472,500 | 4 | 370,000 | 2 | 203,000 | 5 | 406,538 | 13 |
| Total | 820,000 | 2 | 530,000 | 7 | 392,080 | 19 | 421,350 | 66 | 432,006 | 94 |
| Change in Quarter | 36.7% | 75.0% | -0.4% | 18.8% | -5.2% | 11.9% | 0.2% | 19.0% | ||
| Change in year | - | - | 6.8% | 58.3% | 12.3% | -14.3% | 15.5% | 5.6% | ||
| Change in 3 years | - | - | 11.4% | 90.0% | 60.9% | 11.9% | 57.1% | 36.2% | ||
| Change in 5 years | 66.7% | 133.3% | 11.1% | 137.5% | 35.9% | 17.9% | 36.9% | 40.3% | ||
| Change in 10 years | 86.7% | -36.4% | 64.3% | 46.2% | 38.8% | -45.5% | 45.9% | -35.2% | ||
Where do I live? Brentford TW8 postcodes are divided into three sectors, TW8 0xx, TW8 8xx and TW8 9xx. Broadly speaking, TW8 0xx covers areas east of Boston Manor Road, TW8 8xx goes west of Boston Manor Road, whilst TW8 9xx covers the areas to the north of the A4.
Source: Land Registry
February 11, 2014
![]()