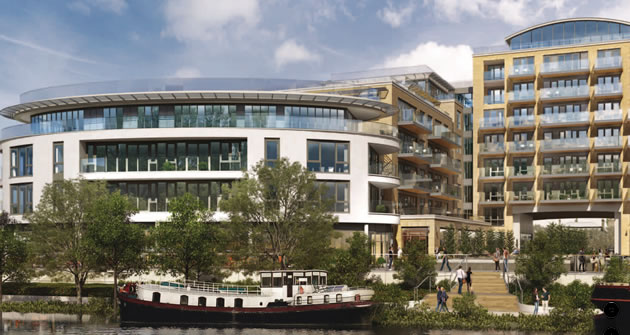
Activity slows and moves away from the Kew Bridge area
|
The average price of a property sold in Brentford in the last three months of 2016 has tumbled as buyer interest moved to the west of the area.
The fall is probably not reflective of a general fall in prices but rather it is caused by cheaper flats to the west of Boston Manor Road being marketed more heavily than the more expensive ones in the Kew Bridge area. These riverside flats drove up the average price in the TW8 post code area earlier in 2016 when they made up nearly 80% of sales. More recently they have comprised under half of the transaction in the area.
At the same time the number of houses changing hands has also drop with just 8 being sold in the last three months of the year.
The average price in TW8 in the fourth quarter of 2016 fell to £411,664 having reached over £600,000 earlier in the year.

The Office of National Statistic's House Price Index is showing that the average price of a home sold in England and Wales was £219,544 in December 2016 up by 7.2%. Having been consistently above the levels seen in the rest of the country prices in London are now rising less quickly than the overall average and now stands at £484,000. This is the first time home values in the capital have underperformed the rest of the country since the financial crisis in 2008.
The number of property sales in England in October 2016, the latest figure available was down 34.5% year on year.
A list of properties sold in the Brentford area will appear in a forthcoming edition of the BrentfordTW8.com newsletter.
| Brentford Property Prices - (October to December 2016) | ||||||||
|---|---|---|---|---|---|---|---|---|
| Area | Semi-det | Sales | Terrace | Sales | Flat/ mais |
Sales | Overall Ave | Total Sales |
| TW8 0 | 0 | 0 | 578433 | 3 | 467095 | 31 | 476919 | 34 |
| TW8 8 | 0 | 0 | 508850 | 2 | 358309 | 34 | 366672 | 36 |
| TW8 9 | 0 | 0 | 470000 | 3 | 282667 | 6 | 345111 | 9 |
| Total | 0 | 0 | 520375 | 8 | 399415 | 71 | 411664 | 79 |
Change in Quarter |
-10.9% | 14.3% | 24.0% | 610.0% | -6.5% | 295.0% | ||
Change in year |
-17.3% | 60.0% | 39.4% | 491.7% | -17.4% | 259.1% | ||
Change in 3 years |
19.6% |
-27.3% |
47.6% |
610.0% |
8.4% |
229.2% |
||
| Change in 5 years | 32.6% | 60.0% | 63.8% | 1083.3% | 25.0% | 464.3% | ||
Change in 10 years |
71.2% | -66.7% | 62.7% | 44.9% | 49.8% | -1.3% | ||
| Brentford Property Prices - (June to September 2016) | ||||||||
|---|---|---|---|---|---|---|---|---|
| Area | Semi-det | Sales | Terrace | Sales | Flat/ mais |
Sales | Overall Ave | Total Sales |
| TW8 0 | 550000 | 1 | 626874 | 4 | 640724 | 68 | 638722 | 73 |
| TW8 8 | 471250 | 2 | 485995 | 1 | 440814 | 11 | 448389 | 14 |
| TW8 9 | 496333 | 3 | 584357 | 7 | 322150 | 10 | 440050 | 20 |
| Total | 496917 | 6 | 590332 | 12 | 580221 | 89 | 576684 | 107 |
Change in Quarter |
-11.3% | 200.0% | -16.6% | 20.0% | -5.2% | -38.2% | -6.6% | -31.4% |
Change in year |
13.9% | 20.0% | 3.7% | -20.0% | 12.4% | -40.7% | 11.2% | -37.1% |
Change in 3 years |
17.7% |
200.0% |
44.6% |
-55.6% |
83.5% |
23.6% |
68.2% |
5.9% |
| Change in 5 years | 15.4% | 20.0% | 72.4% | -36.8% | 106.5% | 89.4% | 87.3% | 50.7% |
Change in 10 years |
81.7% | -50.0% | 87.6% | -68.4% | 133.8% | 45.9% | 110.7% | -3.6% |
Where do I live? Brentford TW8 postcodes are divided into three sectors, TW8 0xx, TW8 8xx and TW8 9xx. Broadly speaking, TW8 0xx covers areas east of Boston Manor Road, TW8 8xx goes west of Boston Manor Road, whilst TW8 9xx covers the areas to the north of the A4.
Source: Land Registry
May 17, 2017
![]()