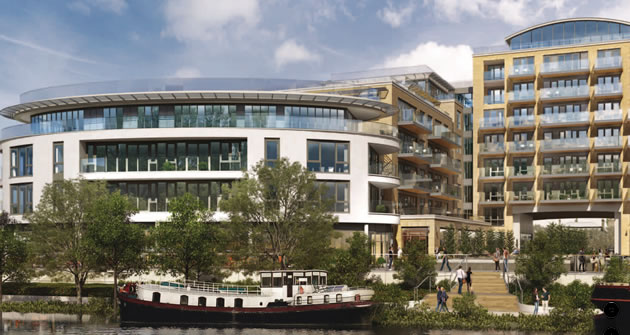
Sales of luxury flats in the Kew Bridge area now dominate local sales
|
The price of the average home sale in Brentford has doubled over the last five years rising to £618,262 so far this year.
However, the rise of 41.4% in the first quarter of 2016 compared to the same period in the previous year has more to do with the kind of properties being sold rather than an across the board rise in prices.
Vik Sharma, of Hunters Estate Agents said, "Sales of the sublime Kew Bridge apartments and property on Baltic Avenue continue to dominate the Brentford property market with prices for some apartments reaching well in excess of £2,000,000. "
The new all-time highs mainly due to high priced sales in Quayside House including two flats going for over a million. Along with Myrtle Court on Baltic Avenue, the Kew Bridge development made up a third of properties sold in an otherwise relatively quiet few months in terms of turnover.
Vik added, "Prices in general have doubled during the past 5 years as many buyers flock to Brentford from the nearby towns looking for a cheaper alternative. We also saw a sharp increase in activity this year coming unto April as buyers looked to avoid increased stamp duty levels which came into effect on the 1st April for investors. However since the higher tax rates have kicked in we can see a fall in inquires for new properties, mainly due to the high proportion of investors being hit with buy-to-let taxes."
"At Hunters we believe Brentford remains a sound town to invest in with property prices set to continue on a rising trend of 5% a year compared to the UK average of 4.5%. Prices are set to continue rising due to nearby towns such as Ealing and Chiswick pricing out first time buyers and investors alike. Buyers flocking from these towns are generally prepared to offer more for properties as Brentford’s market is still lower in comparison. This has resulted in Hunters achieving record prices for our vendors month on month."

The Land Registry’s March data for London shows a 13.9% rise over the last year to £534,785. This is higher than any other part of the country and makes London's average twice that of any other region including the South East.
Annual growth of 6.7% in March brings the average house price in England and Wales to £189,901.
Over the last year prices in the London Borough of Hounslow rose by 14.7% to £415,267.
The latest survey by the Royal Institution of Chartered Surveyors (RICS) has revealed that growth in the private and public housing sectors in London slowed down considerably. Private housing workloads rose at their slowest pace since Q4 2012, with only 20% more of those working in the sector reporting a rise in activity rather than a fall over the first quarter of 2016. During the last quarter of 2015 that figure was 44 per cent.
This easing in the private housing sector has not been offset by any increase in the construction of public housing, with growth in this sector remaining broadly unchanged from the previous quarter, and just 11% more surveyors reporting a rise rather than a fall in activity.
RICS Chief Economist, Simon Rubinsohn said, “On the surface, it might seem surprising that we are witnessing a slowdown in the construction sector just a few months after hearing the Chancellor’s ‘We Are The Builders’ speech, given the Government’s significant commitment to this sector. One might well ask why growth in private housing workloads is softening at a time when policy is firmly focussed on the creation of new starter homes. We have long held the view that starter homes cannot be the only solution. There is an issue around the availability of land on which new houses can be built, and we would like to see more being done to free up private brownfield sites.
“Our survey tells us that planning delays are one of the biggest barriers to growth in the construction sector. We have recommended that councils work together to create a team of emergency planners who can parachute into boroughs that are experiencing significant delays, therefore reducing a major growth barrier.
“That said, we cannot discount the climate of uncertainty caused by the forthcoming EU referendum. We know that a range of sectors have been affected by these issues as investors look to delay.
A list of properties sold in the Brentford area will appear in a forthcoming edition of the BrentfordTW8.com newsletter.
| Brentford Property Prices - (January - March 2016) | ||||||||||
|---|---|---|---|---|---|---|---|---|---|---|
| Area | Detached | Sales | Semi-det | Sales | Terrace | Sales | Flat/ mais |
Sales | Overall Ave | Total Sales |
TW8 0 |
0 |
0 |
0 |
0 |
530332 |
6 |
610839 |
43 |
600981 |
49 |
TW8 8 |
0 |
0 |
0 |
0 |
840000 |
1 |
411667 |
3 |
518750 |
4 |
TW8 9 |
1575000 |
1 |
918967 |
2 |
697667 |
3 |
342500 |
2 |
773867 |
8 |
Total |
1575000 |
1 |
918967 |
2 |
611499 |
10 |
587210 |
48 |
618262 |
61 |
Change in Quarter |
-27.6% |
0.0% |
73.3% |
-66.7% |
5.6% |
-61.5% |
16.7% |
-63.9% |
17.5% |
-63.3% |
Change in year |
314.5% |
0.0% |
35.5% |
-60.0% |
5.6% |
0.0% |
42.4% |
-53.4% |
41.4% |
-48.7% |
Change in 3 years |
- |
- |
137.1% |
-50.0% |
55.3% |
-37.5% |
32.1% |
-18.6% |
43.3% |
-22.8% |
| Change in 5 years | - |
- |
112.4% |
-50.0% |
91.6% |
42.9% |
117.3% |
140.0% |
104.5% |
96.8% |
Change in 10 years |
- |
- |
240.6% |
-77.8% |
116.7% |
-73.7% |
116.4% |
-31.4% |
125.0% |
-47.9% |
| Brentford Property Prices - (October - December 2015) | ||||||||||
|---|---|---|---|---|---|---|---|---|---|---|
| Area | Detached | Sales | Semi-det | Sales | Terrace | Sales | Flat/ mais |
Sales | Overall Ave | Total Sales |
| TW8 0 | 0 | 0 | 0 | 0 | 504112 | 13 | 520135 | 88 | 518072 | 101 |
| TW8 8 | 0 | 0 | 487500 | 2 | 640000 | 3 | 475588 | 13 | 504314 | 18 |
| TW8 9 | 2175000 | 1 | 524000 | 3 | 599250 | 4 | 294409 | 11 | 493816 | 19 |
| Total | 2175000 | 1 | 509400 | 5 | 543523 | 20 | 492795 | 112 | 512938 | 138 |
| Change in Quarter | 16.8% | 0.0% | -6.2% | 25.0% | -3.8% | -15.8% | -0.7% | -10.4% | ||
| Change in year | 60.9% | 0.0% | 22.7% | 400.0% | -0.3% | 17.6% | 31.6% | -11.8% | 27.8% | -5.5% |
| Change in 3 years | 42.8% |
66.7% | 49.7% |
25.0% | 75.9% | 250.0% | 65.1% | 170.6% | ||
| Change in 5 years | 66.1% | 100.0% | 102.1% | 138.3% | 98.5% | 142.1% | ||||
| Change in 10 years | 79.4% | -13.0% | 83.2% | 60.0% | 82.6% | 27.8% | ||||
Where do I live? Brentford TW8 postcodes are divided into three sectors, TW8 0xx, TW8 8xx and TW8 9xx. Broadly speaking, TW8 0xx covers areas east of Boston Manor Road, TW8 8xx goes west of Boston Manor Road, whilst TW8 9xx covers the areas to the north of the A4.
Source: Land Registry
May 13, 2016
![]()