Multi-million pound sale in Butts masks fall in flat prices
|
The latest official figures show that the average property price in the TW8 post code area has reached a new all-time high.
In the third quarter of 2014, the average sale price in Brentford was £441,410 according to the Land Registry, up by 4.7% on the previous three months.
However, the headline figure was inflated by the sale of a property in Upper Butts for £3,265,000. Excluding that the average would be below levels reached in previous quarters.
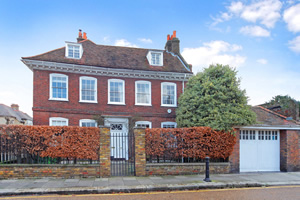
The Queen Anne detached house in the conservation area is over 5,500 square feet and has a beautifully stocked walled garden, a large wine cellar and an architect-designed indoor pool suite. The sale was well above the previous record set earlier in the year by a flat in the 8, Kew Bridge Road development.
The detached seven-bedroom house in tempted a Chiswick resident to move away from W4.
Alastair Hilton of Winkworth who handled the sale commented: "Brentford continues to be a strong market, with many buyers looking to buy here for either a place to live or as an investment. The strength of the Brentford market was shown with the record price achieved by Winkworth of £3,2650,000 for a detached house in The Butts.
"In my opinion, terraced houses in this area are still underpriced and I would expect to see the prices of these rising quite sharply in the next couple of years. With the amount of development taking place, it is certainly an area worth considering for medium term investment."
Flat prices, which make up the bulk of the sales in the area, were down 9.1% compared to the previous quarter although they are still 20% above the level seen last year.
Turnover is only half the level of the second quarter probably due to more limited marketing of new build developments taking place during the summer months.
London property prices generally are up by 18.4% to £460,521 in the year to end September according to the Land Registry although they are slightly down from the level seen at the end of August. The a average house price in England and Wales is now £177,299 compared with the peak of £181,324 in November 2007. This is a rise of 7.2% compared with the same month last year.
The most up-to-date figures available show that during July 2014 the number of completed house sales in England & Wales increased by 7 per cent to 79,214 compared with 73,749 in July 2013. The number of properties sold in England and Wales for over £1 million in July 2014 increased by 19 per cent to 1,439 from 1,207 in July 2013.
The Royal Institution of Chartered Surveyors (RICS) are striking a cautious note pointing out that demand for property in London has been down for six months in a row. Prices are also falling in more recent months according to their survey which covers sales up to the end of October.
London is experiencing a fall in buyer demand with 62% more chartered surveyors reporting a fall over the last month. Significantly, a little more stock is now coming onto the market with 15% more chartered surveyors seeing a rise in new instructions up from 3% more last month. The RICS say that this points to the market in London moving towards a more sustainable position and they remain modestly positive on a twelve month view.
In London, tenant demand was broadly flat over the last quarter. Despite this, rents are still expected to continue to move higher albeit by a little less than 2 per cent over the next twelve months.
Simon Rubinsohn, RICS Chief Economist, said, 'The flatter trend in the market is partly a reflection of potential buyers becoming a little more cautious about making a purchase as more stringent lending criteria has made it harder to access mortgage finance. An increasing awareness of the approaching general election also appears to be contributing to the softer market if the responses to the latest survey are anything to go by. However, with new instructions still flat at a headline level as has been the case for most of the last year it seems implausible that the dip in demand will result in very much of a decline in house prices.'
A list of properties sold in the Brentford area will appear in a forthcoming edition of the BrentfordTW8.com newsletter.
| Brentford Property Prices - (July - September 2014) | ||||||||||
|---|---|---|---|---|---|---|---|---|---|---|
| Area | Detached | Sales | Semi-detached | Sales | Terraced | Sales | Flat/ mais |
Sales | Overall Ave | Overall Sales |
| TW8 0 | - | - | 389500 | 1 | 531000 | 7 | 417696 | 37 | 434694 | 45 |
| TW8 8 | 3265000 | 1 | - | - | 362500 | 4 | 340296 | 23 | 447921 | 28 |
| TW8 9 | - | - | 487750 | 5 | 514286 | 14 | 328200 | 10 | 445543 | 29 |
| Total | 3265000 | 1 | 471375 | 6 | 494680 | 25 | 379479 | 70 | 441410 | 102 |
| Change in quarter | -3.8% | 20.0% | 6.4% | 150.0% | -9.1% | -63.4% | 4.7% | -50.7% | ||
| Change in year | 11.6% | 200.0% | 21.1% | -7.4% | 20.0% | -2.8% | 28.7% | 1.0% | ||
| 9.5% | 20.0% | 44.5% | 31.6% | 35.1% | 48.9% | 43.3% | 43.7% | |||
| Change in 5 years | 64.3% | 50.0% | 79.9% | 257.1% | 55.0% | 94.4% | 74.5% | 117.0% | ||
| Change in 10 years | 59.3% | -60.0% | 77.7% | 8.7% | 70.6% | -42.1% | 85.9% | -35.8% | ||
| Brentford Property Prices - (April - June 2014) | ||||||||||
|---|---|---|---|---|---|---|---|---|---|---|
| Area | Detached | Sales | Semi-detached | Sales | Terraced | Sales | Flat/ mais |
Sales | Overall Ave | Overall Sales |
| TW8 0 | 0 | 0 | 320000 | 1 | 475000 | 5 | 434741 | 135 | 435355 | 141 |
| TW8 8 | 450000 | 1 | 0 | 0 | 0 | 0 | 401256 | 45 | 402315 | 46 |
| TW8 9 | 0 | 0 | 532250 | 4 | 454700 | 5 | 270818 | 11 | 369075 | 20 |
| Total | 450000 | 1 | 489800 | 5 | 464850 | 10 | 417411 | 191 | 421609 | 207 |
| Change in Quarter | 15.9% | -37.5% | -0.6% | -47.4% | 32.5% | 148.1% | 20.1% | 99.0% | ||
| Change in year | -7.6% | -28.6% | 18.6% | -47.4% | -0.9% | 189.4% | -2.4% | 120.2% | ||
| Change in 3 years | 41.0% | 0.0% | 28.3% | 42.9% | 74.2% | 306.4% | 60.1% | 250.8% | ||
| Change in 5 years | 98.8% | -28.6% | 65.2% | 0.0% | 70.4% | 1023.5% | 64.7% | 508.8% | ||
| Change in 10 years | 68.3% | -75.0% | 64.5% | -72.2% | 51.7% | 148.1% | 50.8% | 55.6% | ||
Where do I live? Brentford TW8 postcodes are divided into three sectors, TW8 0xx, TW8 8xx and TW8 9xx. Broadly speaking, TW8 0xx covers areas east of Boston Manor Road, TW8 8xx goes west of Boston Manor Road, whilst TW8 9xx covers the areas to the north of the A4.
Source: Land Registry
November 14, 2014
![]()