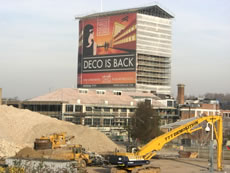
Drop in sales at Kew Bridge Road brings down average price
|
The surge in sales and prices in the TW8 post code area has proved to be short lived. The latest official figures show that property prices in Brentford fell by 7.2% in the third quarter of 2012 compared with the previous three months.
The average price of a home in Brentford is now £347,350 compared to the peak level of £374,192 seen in the second quarter of this year.
The main reason for the fall seems to be a sharp decline in the number of flats being sold particularly in the more expensive Kew Bridge Road development. Sales of the more attractive units in this scheme brought about a surge of purchases in the area but this has ground to a halt in recent months. A probable explanation is that the developer is left with more 'hard-to-sell' units.
Prices of semi-detached and terraced houses appear to be still rising but the number sold remains small, so it is difficult to reach a firm conclusion about the general trend. Of the 76 properties sold in the third quarter only 16 were houses. The level of terraced houses changing hands is down by nearly two thirds with that seen a decade ago.
London was the region in England and Wales which experienced the greatest increase in its average property value over the last 12 months with a movement of 5.5 per cent.
The September data from Land Registry's flagship House Price Index shows an annual price increase nationally of 1.1 per cent which takes the average property value in England and Wales to £162,561.
The most up-to-date figures available show that during July 2012, the number of completed house sales in England and Wales decreased by 9 per cent to 56,509 compared with 62,303 in July 2011.
The number of properties sold in England and Wales for over £1 million in July 2012 increased by 13 per cent to 817 from 725 in July 2011.
A list of properties sold in the Brentford area will appear in a forthcoming edition of the BrentfordTW8.com newsletter.
| Brentford Property Prices - July to September 2012 | ||||||||
|---|---|---|---|---|---|---|---|---|
| Area | Semi-Det | Sales | Terraced | Sales | Flat/Mais | Sales | Total Averages | Total Sales |
| TW8 0 | 0 | 0 | 404195 | 10 | 354375 | 41 | 364144 | 51 |
| TW8 8 | 503333 | 3 | 0 | 0 | 283488 | 13 | 324709 | 16 |
| TW8 9 | 0 | 0 | 456833 | 3 | 210241 | 6 | 292438 | 9 |
| Total | 503333 | 3 | 416342 | 13 | 324603 | 60 | 347350 | 76 |
| Change in Quarter | - | - | 13.4% | 8.3% | -13.5% | -22.1% | -7.2% | -14.6% |
| Change in year | 16.9% | -40.0% | 21.6% | -31.6% | 15.5% | 27.7% | 12.8% | 7.0% |
| Change in 3 years | 75.5% | -25.0% | 51.4% | 85.7% | 32.6% | 66.7% | 37.3% | 61.7% |
| Change in 5 years | 109.7% | 0.0% | 22.0% | -64.9% | 15.1% | -11.8% | 15.3% | -29.6% |
| Change in 10 years | 126.5% | -81.3% | 54.8% | -65.8% | 23.0% | -17.8% | 33.5% | -40.2% |
Where do I live? Brentford TW8 postcodes are divided into three sectors, TW8 0xx, TW8 8xx and TW8 9xx. Broadly speaking, TW8 0xx covers areas east of Boston Manor Road, TW8 8xx goes west of Boston Manor Road, whilst TW8 9xx covers the areas to the north of the A4.
Source: Land Registry
November 27, 2012
